The S&P500 futures closed at 3057 on Friday. It was volatile week, and they moved in a large range of nearly 100 points this week, with multiple swings of 50-60 points per day, which would be enough to hit stop losses on most traders. Buying at 2980-2990 level and selling at 3020-3030 level paid off multiple times.
Please see the following hourly chart of S&P500 futures, which shows that the futures are in strong uptrend. The futures faced significant resistance at 2880, and above 2880 the futures have been moving higher with relatively less difficulty.
S&P500 Resistance Levels: 3080, 3120
S&P500 Support Levels:3000, 2980.
Absolute stop loss on all long positions is 2960.
For short duration trades, the stop loss is 3000.
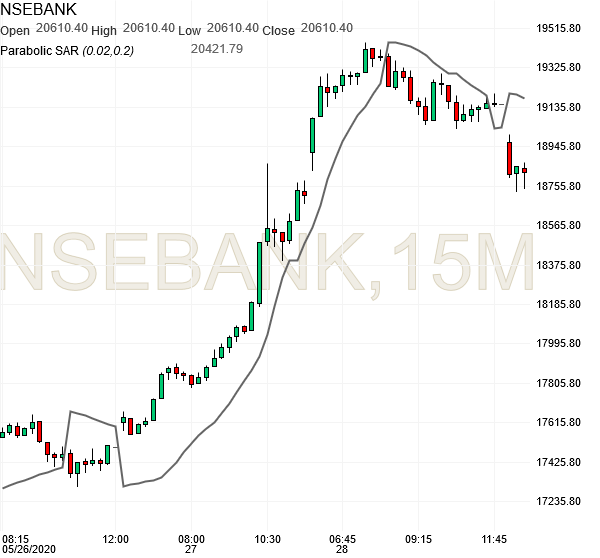
Bank Nifty moved by 2000 points from 17300 to 19300 in two days of 27-28 May 2020.
This was a big move and such a big move can be tracked and traded using a non-linear indicator like the Parabolic SAR. This indicator is not useful in rangebound markets but it can be very useful in trending marketing, like in the above chart.
The challenge is to board a rapidly moving market. Traders have to take the risk of riding the parabolic upmove and once the parabola breaks, that’s the Stop.
We had posted on Twitter in advance last week that 2000 point upmove is visible in the coming days during June 2020, but the upmove came within last week of May 2020!
Futures Trading Services for S&P500, Nasdaq100, Energy & Agri Commodity Futures