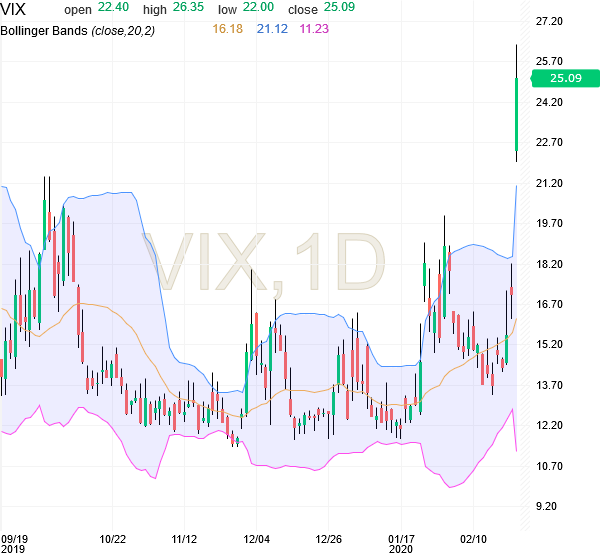
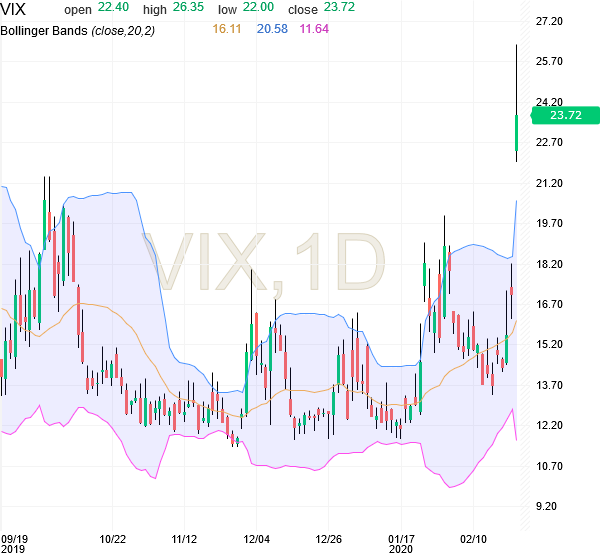
Nasdaq100 futures (NQ) faced sharp correction today, currently at 8823, down 2.93%. In the 30 minutes chart above, its visible that the Nasdaq futures broke their uptrend early today morning, and then kept correcting the whole day. There is a support at 8800, and then at 8650, but we can’t count on them, because the uptrend has broken on daily charts (see below).

The daily chart of Nasdaq futures also shows that the powerful uptrend that started from 6800 levels has broken in last few days, and yesterday’s rally was unable to break back into the uptrend and a sharp corrected followed today. As per this daily chart, the major support is at 8300-8500 level., which much below the current level of 8830. Traders have to be very cautious here, and 9000+ level is needed for any fresh long positions. Thanks.