Category Archives: Natural Gas Futures

Natural Gas Futures Analysis- 21Oct2025

Following is a detailed technical analysis of Henry Hub Natural Gas (NG) futures, based on their daily and weekly chart.
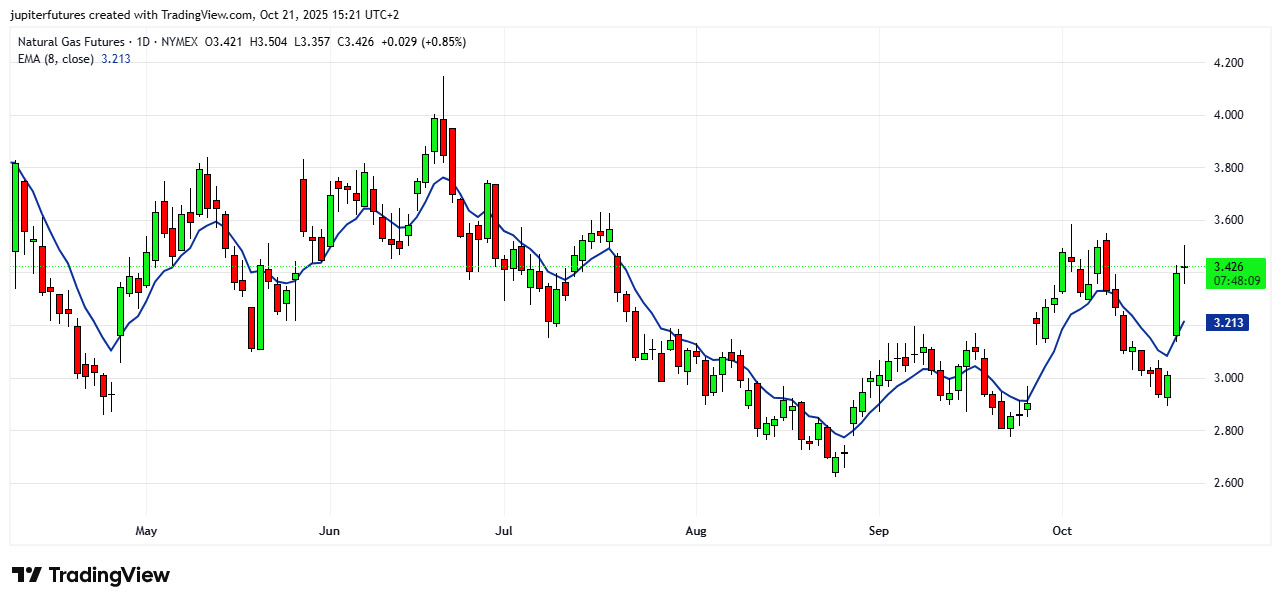
The above chart uses 8 day EMA as the trendline, which we have found to be very useful and reliable for Natural Gas futures trading.

Natural Gas (NG) futures are displaying mixed signals across their daily and weekly charts as of October 21, 2025. While short-term indicators suggest a corrective or consolidative phase, the broader structure remains within a longer-term bullish cycle originating from the 2024 lows.


NG Daily Chart Analysis

The daily chart technical analysis shows Natural Gas currently trading near 3.44 USD/MMBtu, up roughly 1.2% on the day but still beneath its 50-day and 100-day moving averages, reflecting a short-term bearish bias within a volatile consolidation zone.​

  • Moving Averages:
    The 20-day average stands at 2.982 and the 50-day at 3.043, both below the 200-day level at 3.709. This configuration indicates that momentum has weakened but may be stabilizing. The short-term crossover in early October where the 20-day crossed above the 50-day hinted at a temporary upside recovery, though follow-through has been limited.​

  • Momentum Indicators:
    Relative Strength Index (RSI) readings range between 38.6 (9-day) and 45.3 (100-day), suggesting moderately oversold conditions but not a full reversal signal. The stochastic oscillators (K and D around 20%) confirm subdued bullish momentum and potential bottoming signals.​

  • Volatility and Directional Strength:
    Average True Range (ATR) at around 0.13 (4.7%) implies elevated volatility. The ADX reading near 18.4 indicates a weak trend, with selling pressure still dominant given the -DI (24.3) above +DI (16.9). Historical volatility remains high near 35%, signaling the potential for sudden reversals.​

NG Weekly Chart Analysis

On the broader weekly timeframe, Natural Gas has been in a multi-year bullish recovery phase since bottoming in March 2024. Elliott Wave structure analysis suggests that the market is currently in a corrective wave (Y) of a double zigzag formation—implying that prices may still retest lower support before resuming the uptrend.​

  • Elliott Wave Structure:
    The March 2025 top completed a five-wave impulse from the 2024 lows. Since then, waves (W) and (X) of a corrective cycle have unfolded, with wave (Y) now extending potentially toward the 2.10–1.62 zone. This intermediate correction is expected to complete the bearish retracement before a renewed multi-year bullish leg commences.​

  • Trendline and Support:
    The $3.00 level has served as strong support since November 2024, with each pullback so far producing higher weekly lows—maintaining the long-term uptrend structure. A weekly close below 2.85 could, however, open room toward deeper retracement levels, aligning with the Elliott Wave downside targets.​

  • Long-Term Perspective:
    Despite the recent correction, the March 2024 low is most probably a secular bottom for NG. The structural setup continues to favor accumulation on pullbacks, with potential long-term targets up to 10.00 USD/MMBtu once the corrective phase fully resolves.​

NG Technical Analysis – Summary Outlook

Timeframe Trend Support Resistance Momentum Outlook
Daily Sideways / Consolidation 3.00- 2.85 3.50 / 3.70 RSI ~40 Short-term corrective
Weekly Bullish / Consolidation 2.10 – 2.85 3.70 / 4.10 ADX < 20 Long-term uptrend intact

Summary: Natural Gas (NG) futures are undergoing a corrective phase within a larger bullish trend that can take the prices to $5 per MMBTU in the coming 6-12 months. The daily chart indicates a weak or consolidative bias with potential for short-term volatility. Traders should stay long above $3 level. Thanks.

MarketStar Services

Top Performing Commodity Trading Research – for Serious Traders

We publish market research on positional trades (Entry, Target, Stop Loss, Notes) for Crude Oil, Natural Gas, Gold, Silver. 

All subscribers receive the same information at the same time via Google Sheet.


What’s included in Every Subscription Plan

  • Google Sheet access (Global USD or MCX INR stream)

  • Positional trades only (based on Hourly / 4-Hour / Daily charts); no intraday trades, no options trades. Only futures.

  • Clear Entry • Target(s) • Stop Loss • Notes for each trade.

  • Archive of closed trades for transparency.

  • Email support:  jupiterfutures@gmail.com
    (Monday–Friday typically within 24 hours)

Disclaimer: We are a market research publisher. All subscribers receive the same information. Not Investment Advice. We do not provide investment advice or manage your trades or funds. We do not have any visibility into subscriber trading accounts.  There are no guarantees of profits. Market risk is involved in all commodity trading.


Subscribe based on your Trading Goals and Timeframe

To subscribe any of the following packages, please email us to receive PayPal payment link (USD subscription) and UPI details (INR subscription). Please send email to: jupiterfutures@gmail.com


Global Commodity Markets
(Nymex, Comex, CFDs in USD)

Quarterly Plan

  • USD 297 — access for 3 months (first 100 subscribers)
  • Standard Rate: USD 500 per quarter (after100 subscribers)

Yearly Plan

  • USD 997 — access for 1 year (first 100 subscribers)
  • Standard Rate: USD 2000 per year (after100 subscribers)

India Commodity Markets (MCX)

Special Launch Offer for first 100 Subscribers from India

Quarterly Plan

  • INR 15,000  – access for 3 months (first 100 subscribers)
  • Standard Rate: INR 19,500 for 3 months (after 100 subscribers)

Yearly Plan

  • INR 50,000 — access for 1 year (first 100 subscribers)
  • Standard Rate: INR 1 lakh for 12 months (after 100 subscribers)

Please Note: Early subscribers lock in the lowest fees. Pricing will change to Standard Rate for new subscribers after the first 100 seats are filled.


How to Subscribe

  1. Please email  jupiterfutures@gmail.com with your chosen plan (Global USD or MCX INR) and timeframe. Please also share your full name, and your gmail id (for access to Google Sheets).

  2. For Global commodity markets USD subscription. we’ll email you a secure PayPal payment link. For MCX INR subscription, we will share our UPI details for INR payment.

  3. After payment confirmation, you will receive Google Sheet access within 24-48 hours.


Upgrades, Renewals, Access, and Support

  • You can upgrade from Monthly → Quarterly → Yearly anytime (pay the difference on the prevailing rates).

  • Subscription plans do not auto-renew automatically. We will contact you for renewal with an email near the end of your subscription plan.

  • Google Sheets Dashboard access is personal and non-transferable; sharing/redistribution is prohibited.

  • Subscriptions are non-refundable once access is granted (digital service).

  • Support is available via email: info@marketstar.us

Compliance & Risk

  • MarketStar is a market-research publisher. We do not provide personalized advice or execute trades.
  • Futures trading involves substantial risk and may result in loss of capital.
  • Past performance is not indicative of future results.
  • Please read our Disclaimer and Terms of Service.

Got Questions? Good!

Please see our detailed MarketStar FAQ page. or send an email, because we’re here to help. Please contact us here.
MarketStar — Top Performance Commodity Trading |  Transparent Research | AI Trading Systems | Disciplined Framework for Risk Management | Real-Time Learning