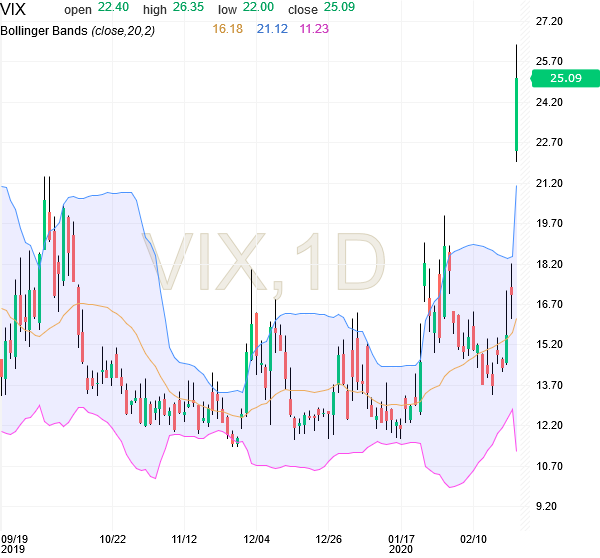
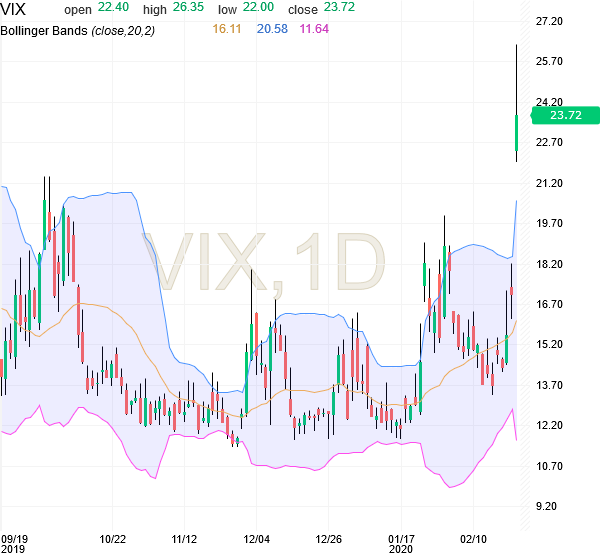
VIX breaking out of the upper Bollinger Band range has been a reliable end to the panic and sell signal, and a good buy signal in last 6-12 months.Today is the most emphatic break out, in fact its like a rocket taking off. This may give a follow on spike in the next 3-4 days, and which may coincide with another deep red day, but two shots is the max VIX has been getting at the upper Bollinger Band range.
[Edit: 13 March 2020] This time it was indeed different, and the VIX spike of 24 Feb 2020, went on to kill the bull market rally, by crashing S&P500 by 25% in 13 trading sessions, at nearly 2% per day!
This service will give you unified view of all the Index futures and ETFs we are tracking, along with their latest buy/sell signals and indicative targets and stop losses, and indicative timeframes for targets (in a few cases).
This Dashboard is updated regularly, as changes happen in status.
The Dashboard is powered by our Trading systems and 20+ years of market experience.
Investors and Traders would decide their actions or trades using the Buy/Sell Trading Signals given on the Dashboard. The deliverable here is Membership access to the Dashboard on our website. You will also receive emails after each update on the dashboard.
There is a single access to the Dashboard, and every Member can see all Trading Signals across various markets.
Service Fee:
– $99 per month
– $249 per quarter
– $785 per year
Please contact us to get started. Thanks.
Futures Trading Service for S&P500, Nasdaq, Nifty, Commodities, Cryptos