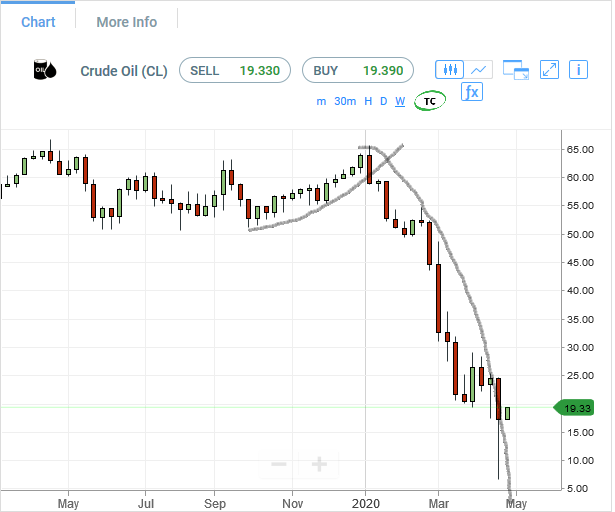
Crude Oil Futures have done near complete liquidation or capitulation that’s possible in markets. Now, its a new Crude Oil, and the downtrend has been broken this week. Current price is near $19 per barrel, and the upside target till $30 is visible, even as part of basic recovery in demand and increase in storage space, which is likely once the US economy restarts in May-June 2020. The supply side has been damaged in this massive price correction since Jan 2020, and that could push WTI crude prices up, and in fact make it the same as Brent Crude once the WTI upward journey starts. The real target is $50 per barrel, which maybe hit by April 2021 if global economy recovers by Feb 2021.
Fundamental Analysis: Crude Oil futures have been correcting ever since they hit a high of $64.50 per barrel at the height of USA-Iran tension, and with calm returning back to the Middle East, the Crude Oil prices have been correcting daily, because supply is coming up constantly in the USA and the global demand is still the same, and not really rising faster than supply. So it’s also in the interest of Crude Oil producers to keep the Crude Oil prices under control without unstable price spirals. $50-60 looks like a price band that can provide stable price zone in the near term.
Technical Analysis: Crude Oil futures are giving Sell signal on various indicators on various near term time frames. Traders can sell with $61 per barrel as Stop loss, because if the current correction is real, then 61 should not come in the first place. Most Stop Losses on Sell trades will be at 60, so that is not suitable as a Stop loss, it should be a bit higher to avoid being caught in a unsustainable price spike due to short covering.
[Bonus Trade] Sell Crude Oil at 59 for Target 55 with Stop loss 61.
Crude Oil Support & Resistance Table – 13 Jan 2020
Support & Resistance
Level
Explanation
Resistance 2
60.630
Daily R2
Resistance 1
59.971
Daily R1
Support 1
58.269
Daily S1
Support 2
57.694
Daily S2
Crude Oil Indicator Table – 13 Jan 2020
Indicator
Signal
SMA 20
Sell
SMA 50
Sell
SMA 100
Sell
MACD( 12;26;9)
Sell
RSI (14)
Sell
Stochastic ( 9;6;3)
Sell
Crude Oil Indicator/ Timeframe Table – 13 Jan 2020
Indicator / Period
Day – Sell
Week – Sell
Month – Buy
MACD( 12;26;9)
Sell
Buy
Buy
RSI (14)
Sell
Sell
Buy
SMA 20
Sell
Sell
Buy
Futures Trading Service for S&P500, Nasdaq, Nifty, Commodities, Cryptos