Tag Archives: Crude Oil Trend

Crude Oil Futures Analysis- 10Nov2020

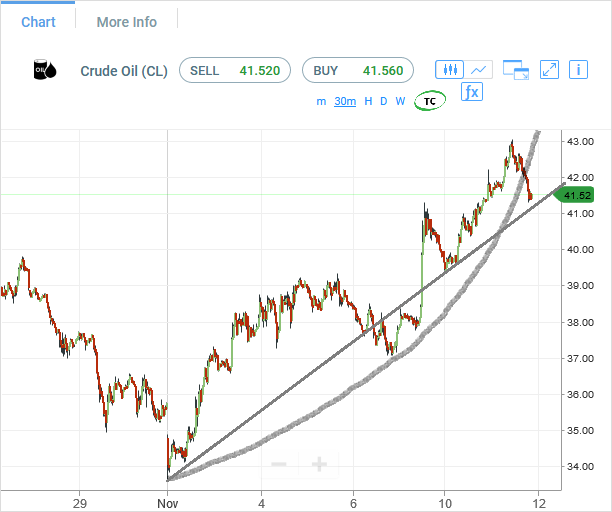
It looks like WTI Crude Oil futures have broken their uptrend today, after hitting $43 per barrel. In the last 10 days, since 1st Nov, the WTI Crude Oil futures have moved up from 34 to 43, nearly 25% gain, which would be amplified 5-10X when we trade with futures.

As per the above chart, the uptrend clearly breaks below 41, so 41 should be the stop loss for all long trades. As mentioned in previous posts, we can stay long above 40, for targets of 44-45, and then 49-50 per barrel. There are two level of Crude Oil Support, one at 39-40 level and other at 34-35 level.

Crude Oil futures are in uptrend currently, and our Crude Oil trading strategy is to buy on corrections and take profit on rallies. The long trades from 37 to 40 has been a reliable trade, and we have done it thrice in last 2 months.

Crude Oil Price Outlook: We should be prepared to see constant readjustment of crude oil prices between $35 and $45 over next 3 months, because the global economic growth is still weak, and crude oil will keep facing supply pressure as soon as it goes towards 45-50 level.

Please contact us to learn more about Crude Oil Trading Service. Thanks.


Crude Oil Futures Analysis- 13Jan2020

Fundamental Analysis: Crude Oil futures have been correcting ever since they hit a high of $64.50 per barrel at the height of USA-Iran tension, and with calm returning back to the Middle East, the Crude Oil prices have been correcting daily, because supply is coming up constantly in the USA and the global demand is still the same, and not really rising faster than supply. So it’s also in the interest of Crude Oil producers to keep the Crude Oil prices under control without unstable price spirals. $50-60 looks like a price band that can provide stable price zone in the near term.

Technical Analysis: Crude Oil futures are giving Sell signal on various indicators on various near term time frames. Traders can sell with $61 per barrel as Stop loss, because if the current correction is real, then 61 should not come in the first place. Most Stop Losses on Sell trades will be at 60, so that is not suitable as a Stop loss, it should be a bit higher to avoid being caught in a unsustainable price spike due to short covering.

[Bonus Trade] Sell Crude Oil at 59 for Target 55 with Stop loss 61.

Crude Oil Support & Resistance Table – 13 Jan 2020

Support & ResistanceLevelExplanation
Resistance 260.630Daily R2
Resistance 159.971Daily R1
Support 158.269Daily S1
Support 257.694Daily S2

Crude Oil Indicator Table – 13 Jan 2020

IndicatorSignal
SMA 20Sell
SMA 50Sell
SMA 100Sell
MACD( 12;26;9)Sell
RSI (14)Sell
Stochastic ( 9;6;3)Sell

Crude Oil Indicator/ Timeframe Table – 13 Jan 2020

Indicator / PeriodDay – SellWeek – SellMonth – Buy
MACD( 12;26;9)SellBuyBuy
RSI (14)SellSellBuy
SMA 20SellSellBuy