Let’s analyze the Nasdaq 100 Futures (NQ) based on its daily chart performance as of the market close on Friday, June 27, 2025.
Overall Trend and Price Action:
The Nasdaq 100 futures have been exhibiting a strong upward trend in the medium to long term. This is indicated by the continuous rise in price and the general sentiment of increasing buy interest among investors.
Recent price action suggests the index has been maintaining its bullish momentum, closing higher on Friday, June 28th, with the September 2025 contract (NQU5) closing around 22740.25, up over 70 points.
The index has consistently been making higher highs and higher lows, a classic sign of an ongoing uptrend.
Key Levels (Support & Resistance):
Current Resistance/New Highs: NQ has been trading near or at all-time highs. The June 27th data indicates a high of 22,825.50, which acts as immediate resistance or a level to watch for potential breakouts.
Immediate Support: Given the recent upward movement, immediate support levels would be observed around the 22,600-22,670 range, which was Friday’s settlement and low.
Stronger Support: Looking back at recent data, there’s a notable support area around 21,500-21,700. Some analyses mention a “return towards the low liquidity zone around 21,700” if there’s a negative reaction to economic news. Further, levels like 21,440 and 20,340 have been identified as significant medium-term pivotal support points. A breakdown below these levels could signal a shift in the bullish scenario.
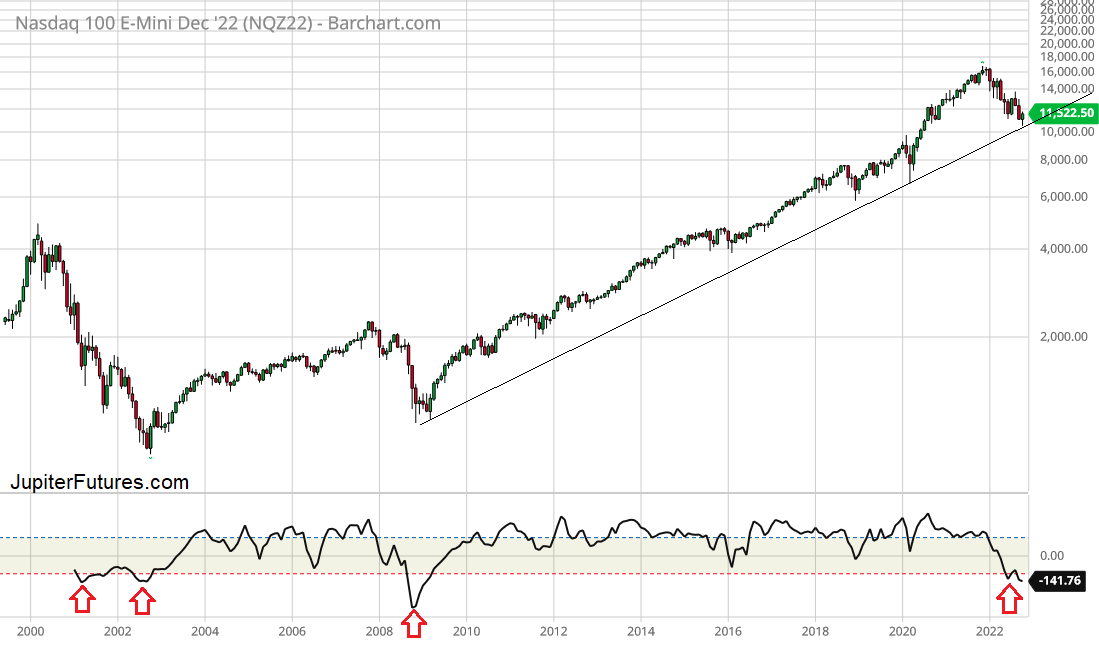
Nasdaq100 futures are currently at 11,522. The Nasdaq futures chart of last 22 years with CCI Momentum Indicator shows we’re in something similar to 2001-2002 period, with double dip below the oversold line in red color. Such a pattern took some time for proper recovery in 2001-2002, and it was also accompanied with war situation that we have today with Russia war on Ukraine (then it was 9/11 tragedy in the US followed by war in Afghanistan).
CCI Indicator is very useful in such analysis. One this is sure from our historical data analysis over the last 50 years: Momentum recovery will be visible before price recovery!
#Nasdaq100 #NQ #NDX #SPX500 #markets
Support & Resistance Levels
Major Nasdaq100 Resistance Level is currently at 13K, which is near the 200 day moving average. Near term resistance is also at 12K, so its also a near term target.
Major Nasdaq100 Support Level is currently at 10K, which is the long term trend line support. Nasdaq futures are looking safe above 10K; and a breakdown can happen below 10K level, with immediate downside target as 8K level.
Please Note: Its the Futures Traders who have to worry about sharp corrections (against their positions) and stop losses, etc. Equity Investors can keep accumulating Nasdaq100 ETF (QQQ) during all this period, with regular buying every month especially during red days and red weeks, for good gains in 2-3 years. Such periods of corrections are ideal for equity investing, and Nasdaq100 ETF (QQQ) is the top pick. Thanks.
Futures Trading Service for S&P500, Nasdaq, Nifty, Commodities, Cryptos