Tag Archives: Natural Gas Futures Support Level

Natural Gas Futures Analysis- 21Oct2025

Following is a detailed technical analysis of Henry Hub Natural Gas (NG) futures, based on their daily and weekly chart.

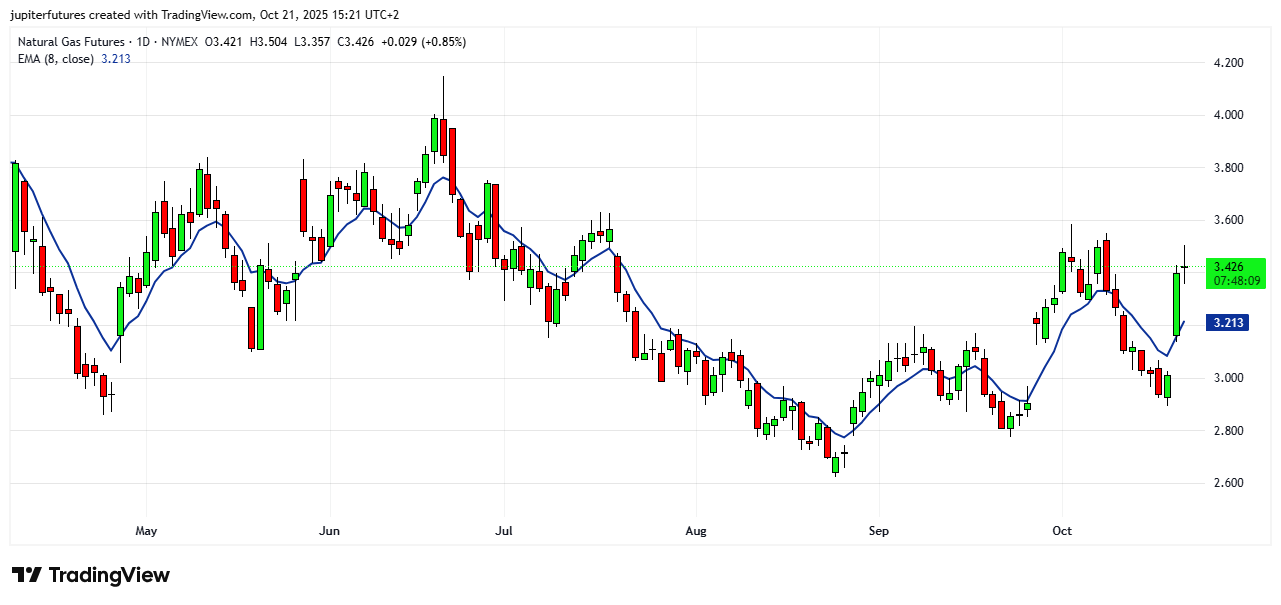
The above chart uses 8 day EMA as the trendline, which we have found to be very useful and reliable for Natural Gas futures trading.

Natural Gas (NG) futures are displaying mixed signals across their daily and weekly charts as of October 21, 2025. While short-term indicators suggest a corrective or consolidative phase, the broader structure remains within a longer-term bullish cycle originating from the 2024 lows.


NG Daily Chart Analysis

The daily chart technical analysis shows Natural Gas currently trading near 3.44 USD/MMBtu, up roughly 1.2% on the day but still beneath its 50-day and 100-day moving averages, reflecting a short-term bearish bias within a volatile consolidation zone.​

  • Moving Averages:
    The 20-day average stands at 2.982 and the 50-day at 3.043, both below the 200-day level at 3.709. This configuration indicates that momentum has weakened but may be stabilizing. The short-term crossover in early October where the 20-day crossed above the 50-day hinted at a temporary upside recovery, though follow-through has been limited.​

  • Momentum Indicators:
    Relative Strength Index (RSI) readings range between 38.6 (9-day) and 45.3 (100-day), suggesting moderately oversold conditions but not a full reversal signal. The stochastic oscillators (K and D around 20%) confirm subdued bullish momentum and potential bottoming signals.​

  • Volatility and Directional Strength:
    Average True Range (ATR) at around 0.13 (4.7%) implies elevated volatility. The ADX reading near 18.4 indicates a weak trend, with selling pressure still dominant given the -DI (24.3) above +DI (16.9). Historical volatility remains high near 35%, signaling the potential for sudden reversals.​

NG Weekly Chart Analysis

On the broader weekly timeframe, Natural Gas has been in a multi-year bullish recovery phase since bottoming in March 2024. Elliott Wave structure analysis suggests that the market is currently in a corrective wave (Y) of a double zigzag formation—implying that prices may still retest lower support before resuming the uptrend.​

  • Elliott Wave Structure:
    The March 2025 top completed a five-wave impulse from the 2024 lows. Since then, waves (W) and (X) of a corrective cycle have unfolded, with wave (Y) now extending potentially toward the 2.10–1.62 zone. This intermediate correction is expected to complete the bearish retracement before a renewed multi-year bullish leg commences.​

  • Trendline and Support:
    The $3.00 level has served as strong support since November 2024, with each pullback so far producing higher weekly lows—maintaining the long-term uptrend structure. A weekly close below 2.85 could, however, open room toward deeper retracement levels, aligning with the Elliott Wave downside targets.​

  • Long-Term Perspective:
    Despite the recent correction, the March 2024 low is most probably a secular bottom for NG. The structural setup continues to favor accumulation on pullbacks, with potential long-term targets up to 10.00 USD/MMBtu once the corrective phase fully resolves.​

NG Technical Analysis – Summary Outlook

Timeframe Trend Support Resistance Momentum Outlook
Daily Sideways / Consolidation 3.00- 2.85 3.50 / 3.70 RSI ~40 Short-term corrective
Weekly Bullish / Consolidation 2.10 – 2.85 3.70 / 4.10 ADX < 20 Long-term uptrend intact

Summary: Natural Gas (NG) futures are undergoing a corrective phase within a larger bullish trend that can take the prices to $5 per MMBTU in the coming 6-12 months. The daily chart indicates a weak or consolidative bias with potential for short-term volatility. Traders should stay long above $3 level. Thanks.

Natural Gas Futures Analysis- 27June2025

Technical Analysis: Natural Gas Futures (NG) – Daily Chart (as of June 27, 2025)

Natural Gas futures (NG) had a dynamic week, showing some significant upward moves on Friday, June 27, 2025. The August Nymex natural gas (NGQ25) closed sharply higher by over 6% on Friday, around $3.739 per MMBtu.

Overall Trend and Price Action:

  • NG has seen a strong bullish surge recently, particularly on Friday, driven by anticipation of hotter US weather.
  • This latest move confirmed a bullish continuation after testing support bases at 50 day SMA level.
  • In the medium term, there’s been a significant recovery. Earlier in April, some analysts noted NG transitioning from a long bear market into a new upcycle, with a “Golden Cross” (50 > 200 DMA) occurring in October 2024, indicating a long-term bullish signal — but there is nothing called “long term bullish” in NG as new supply keeps coming as prices go up.

Key Levels (Support & Resistance):

  • Immediate Resistance/Target: Price is approaching or testing a significant resistance zone. Some forecasts indicated initial extra target at $3.90 or $4.00.
  • Immediate Support:
    • The price ended yesterday’s trading by testing a support base near $3.470, before rebounding strongly.
    • Further support noted around $3.580 (moving average 55) which held stability, and $3.610.
  • Stronger Support: A “key support” level was mentioned around $3.00-$3.20 earlier, which, if tested and held, would further confirm the bullish reversal.

Moving Averages:

  • The overall picture for moving averages is strongly bullish.
  • All short-term and medium-term moving averages (MA5, MA10, MA20, MA50) are generally showing a “Buy” signal, with the current price well above them.
  • The 200-day moving average, while potentially acting as resistance in some contexts, is less relevant for the current strong short-term bullish move, and the “Golden Cross” earlier indicates long-term support.

Technical Indicators:

  • RSI (Relative Strength Index): The 14-day RSI is around 77.566 (as of June 27), indicating significantly overbought conditions. This suggests the rally has been very strong, and while momentum is high, a pullback or consolidation cannot be ruled out.
  • Stochastics (9,6): Around 85.264 or 100 (StochRSI), also firmly in overbought territory, confirming the strong buying pressure.
  • MACD (Moving Average Convergence Divergence): Showing a “Buy” signal (e.g., 0.045 as of June 27), confirming the bullish momentum.
  • ADX (Average Directional Index): Around 84.323, indicating an “Overbought” condition and a very strong trend.

Chart Patterns (Based on textual descriptions):

  • The price action on Friday, surging higher after a larger-than-expected build in weekly EIA inventories (which would normally be bearish), suggests that weather forecasts for hotter US weather are currently overriding fundamental supply data. This kind of “weather-driven” rally is typical for natural gas.
  • Earlier, patterns like a “Triangle + falling wedge breakout” were mentioned as bottoming structures.

Outlook and Key Considerations:

  • Weather Forecasts: Short-term natural gas prices are extremely sensitive to weather. Hotter-than-normal summer forecasts for key demand regions will continue to be a primary driver for upside.
  • Storage Levels: EIA storage reports will remain crucial. While Friday saw a price surge despite a build, persistent large builds could eventually weigh on prices.
  • Long-Term Trend Confirmation: The presence of a “Golden Cross” and the strong bullish signals from indicators suggest that NG might be in the early stages of a longer-term bullish cycle, following a multi-year bottom.
  • Risk of Pullback: Given the severely overbought conditions (RSI, Stochastics, ADX), there is a significant risk of a healthy pullback or consolidation. However, strong trends can remain overbought for extended periods.

Summary: Natural Gas (NG) futures have shown a powerful surge, driven by weather expectations, and are firmly in a bullish trend. While short-term overbought conditions exist, the underlying bullish momentum appears strong, making the impact of upcoming weather and storage reports paramount.