Nasdaq Futures are recovering after hitting a low near 10,650 yesterday (Monday) morning. The 200 SMA on the 5 hour chart is a very likely target for the current upmove, which has been in progress since yesterday afternoon. The first indication of this recovery came in the first proper upmove yesterday afternoon, when the Nasdaq futures moved up by 150 points from 10,810 to 10,960 in one hour. That was the foundation of today’s upmove, and now the target of 11,300 is visible, which is the 200 SMA on the 5 hour chart. 11,300 will be a resistance level and we can expect selling pressure at that level.
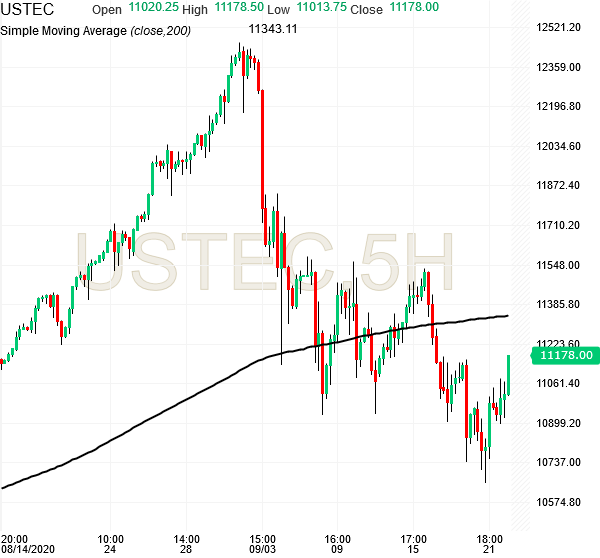
The 200 SMA on the 5 hour chart is upward sloping (in uptrend), so the probability of it getting tested is high (much higher than if that was in down trend), because the Sellers would want to make sure that selling pressure is there if prices go higher. If buying starts coming in, then the Sellers will have to close their positions.

The 200 SMA on the Hourly chart was giving 11,150 as the target and it was achieved today. The Nasdaq futures have support at 10,900 level, but overall weakness is there and 10,500 is possible once 11,000 level is broken. Therefore, long trades have to be done very carefully. Exit longs below 10,900 (this was also the key support level earlier). Clean long trades will be possible above 11,600 for target 12,000 and above. Thanks.
