Tag Archives: NG

Natural Gas Trading Lessons

Most important points for Natural Gas Trading.

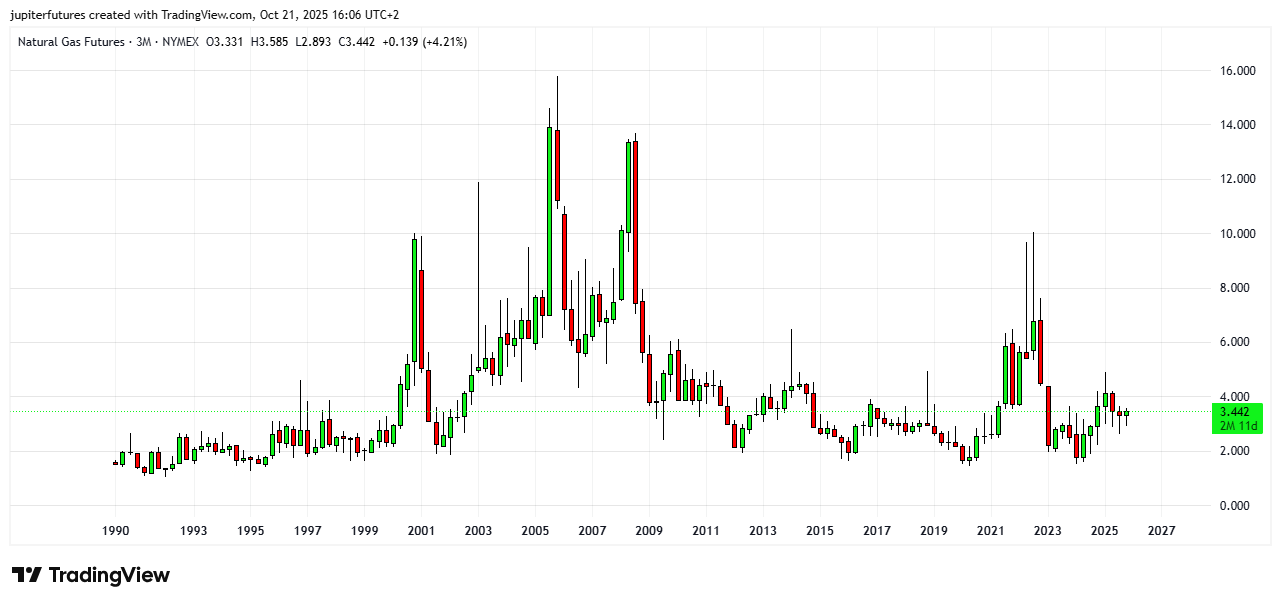
Please remember this very important point: In the last 35 years of Natural Gas (NG) futures charts — from April 1990 to October 2025 — NG has never been able hold on to higher levels above $5 for any longer duration than 3-4 months, because the Natural Gas production keeps rising rapidly often outpacing the demand, so the NG prices remain between $2-4 per MMBTU for most of the time, with $3 per MMBTU as the long term support level. That rate seems to give enough profit for the Natural Gas producers to remain profitable. So at higher rates like $7-8, the Natural Gas producers themselves become big sellers of NG futures, to lock in the higher rates, because they know that NG production will rise rapidly at higher rates, which will take NG rates down.

So when you see higher rates like $6-7 per MMBTU or more, you must take profits on your long positions and become very cautious with fresh new long positions. Above $5, it will be a very bullish sentiment, and trading gains can come rapidly in that zone. Keep your position size in control. Work with strict stop losses, to avoid large losses from sharp corrections.

NG has not been able to hold any rates above $5 for long duration. Any price spikes above $5 would most probably be due to short covering or market technical reasons, and not fundamental reasons, because  the supply of Natural Gas keeps rising to meet demand. Experienced traders can consider selling NG futures at rates above $7 for the inevitable correction back to $3. 

Remember this: NG is not Gold. NG has no appreciating property.
NG is closer to Oxygen, and even more abundant than Crude Oil.
Everybody needs Oxygen but you can’t command a big price for it.

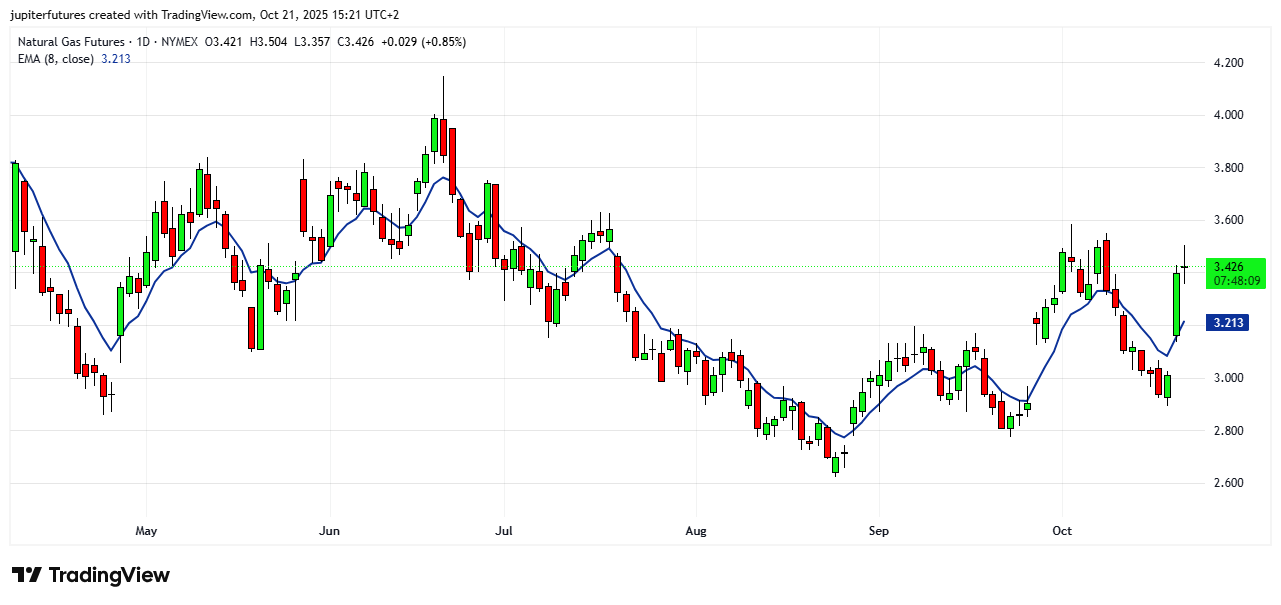
The best way to make money for Natural Gas Trading is to work month to month, and live in the present, focus on the current technical setup and trade accordingly. Don’t predict the future, and don’t look too far. Trade for this month.

The inherent volatility of NG futures is a big opportunity for traders. Holding NG won’t make you rich, but trading NG can surely make you rich. Thanks. Wishing you all the best!

Shankar AVSB
Founder, Jupiter Futures
Founder, MarketStar Commodity Trading

Natural Gas Futures Analysis- 21Oct2025

Following is a detailed technical analysis of Henry Hub Natural Gas (NG) futures, based on their daily and weekly chart.

The above chart uses 8 day EMA as the trendline, which we have found to be very useful and reliable for Natural Gas futures trading.

Natural Gas (NG) futures are displaying mixed signals across their daily and weekly charts as of October 21, 2025. While short-term indicators suggest a corrective or consolidative phase, the broader structure remains within a longer-term bullish cycle originating from the 2024 lows.


NG Daily Chart Analysis

The daily chart technical analysis shows Natural Gas currently trading near 3.44 USD/MMBtu, up roughly 1.2% on the day but still beneath its 50-day and 100-day moving averages, reflecting a short-term bearish bias within a volatile consolidation zone.​

  • Moving Averages:
    The 20-day average stands at 2.982 and the 50-day at 3.043, both below the 200-day level at 3.709. This configuration indicates that momentum has weakened but may be stabilizing. The short-term crossover in early October where the 20-day crossed above the 50-day hinted at a temporary upside recovery, though follow-through has been limited.​

  • Momentum Indicators:
    Relative Strength Index (RSI) readings range between 38.6 (9-day) and 45.3 (100-day), suggesting moderately oversold conditions but not a full reversal signal. The stochastic oscillators (K and D around 20%) confirm subdued bullish momentum and potential bottoming signals.​

  • Volatility and Directional Strength:
    Average True Range (ATR) at around 0.13 (4.7%) implies elevated volatility. The ADX reading near 18.4 indicates a weak trend, with selling pressure still dominant given the -DI (24.3) above +DI (16.9). Historical volatility remains high near 35%, signaling the potential for sudden reversals.​

NG Weekly Chart Analysis

On the broader weekly timeframe, Natural Gas has been in a multi-year bullish recovery phase since bottoming in March 2024. Elliott Wave structure analysis suggests that the market is currently in a corrective wave (Y) of a double zigzag formation—implying that prices may still retest lower support before resuming the uptrend.​

  • Elliott Wave Structure:
    The March 2025 top completed a five-wave impulse from the 2024 lows. Since then, waves (W) and (X) of a corrective cycle have unfolded, with wave (Y) now extending potentially toward the 2.10–1.62 zone. This intermediate correction is expected to complete the bearish retracement before a renewed multi-year bullish leg commences.​

  • Trendline and Support:
    The $3.00 level has served as strong support since November 2024, with each pullback so far producing higher weekly lows—maintaining the long-term uptrend structure. A weekly close below 2.85 could, however, open room toward deeper retracement levels, aligning with the Elliott Wave downside targets.​

  • Long-Term Perspective:
    Despite the recent correction, the March 2024 low is most probably a secular bottom for NG. The structural setup continues to favor accumulation on pullbacks, with potential long-term targets up to 10.00 USD/MMBtu once the corrective phase fully resolves.​

NG Technical Analysis – Summary Outlook

Timeframe Trend Support Resistance Momentum Outlook
Daily Sideways / Consolidation 3.00- 2.85 3.50 / 3.70 RSI ~40 Short-term corrective
Weekly Bullish / Consolidation 2.10 – 2.85 3.70 / 4.10 ADX < 20 Long-term uptrend intact

Summary: Natural Gas (NG) futures are undergoing a corrective phase within a larger bullish trend that can take the prices to $5 per MMBTU in the coming 6-12 months. The daily chart indicates a weak or consolidative bias with potential for short-term volatility. Traders should stay long above $3 level. Thanks.